mirror of
https://github.com/olehomelchenko/olehomelchenko.com.git
synced 2025-12-21 21:22:22 +00:00
1050 lines
22 KiB
Markdown
1050 lines
22 KiB
Markdown
---
|
|
title: "Bar Charts: Makeover in Vega-Lite"
|
|
date: 2025-07-07
|
|
draft: false
|
|
|
|
load_vega: true
|
|
tags:
|
|
- dataviz
|
|
- vega-lite
|
|
- makeover
|
|
---
|
|
|
|
## oeuth
|
|
|
|
Of all tools for data visualization, I mostly enjoy working with Vega-Lite. As I enhance my skills in making the visualizations using it, I become increasingly interesting not just in the "dataviz" part of its capabilities, but also on making it aesthetically compelling, as well as challenging myself to reach the limits of what is possible with Vega-Lite. I am by no means near the limits so far, however I got increasingly interested in replicating the charts I see throughout the internet.
|
|
|
|
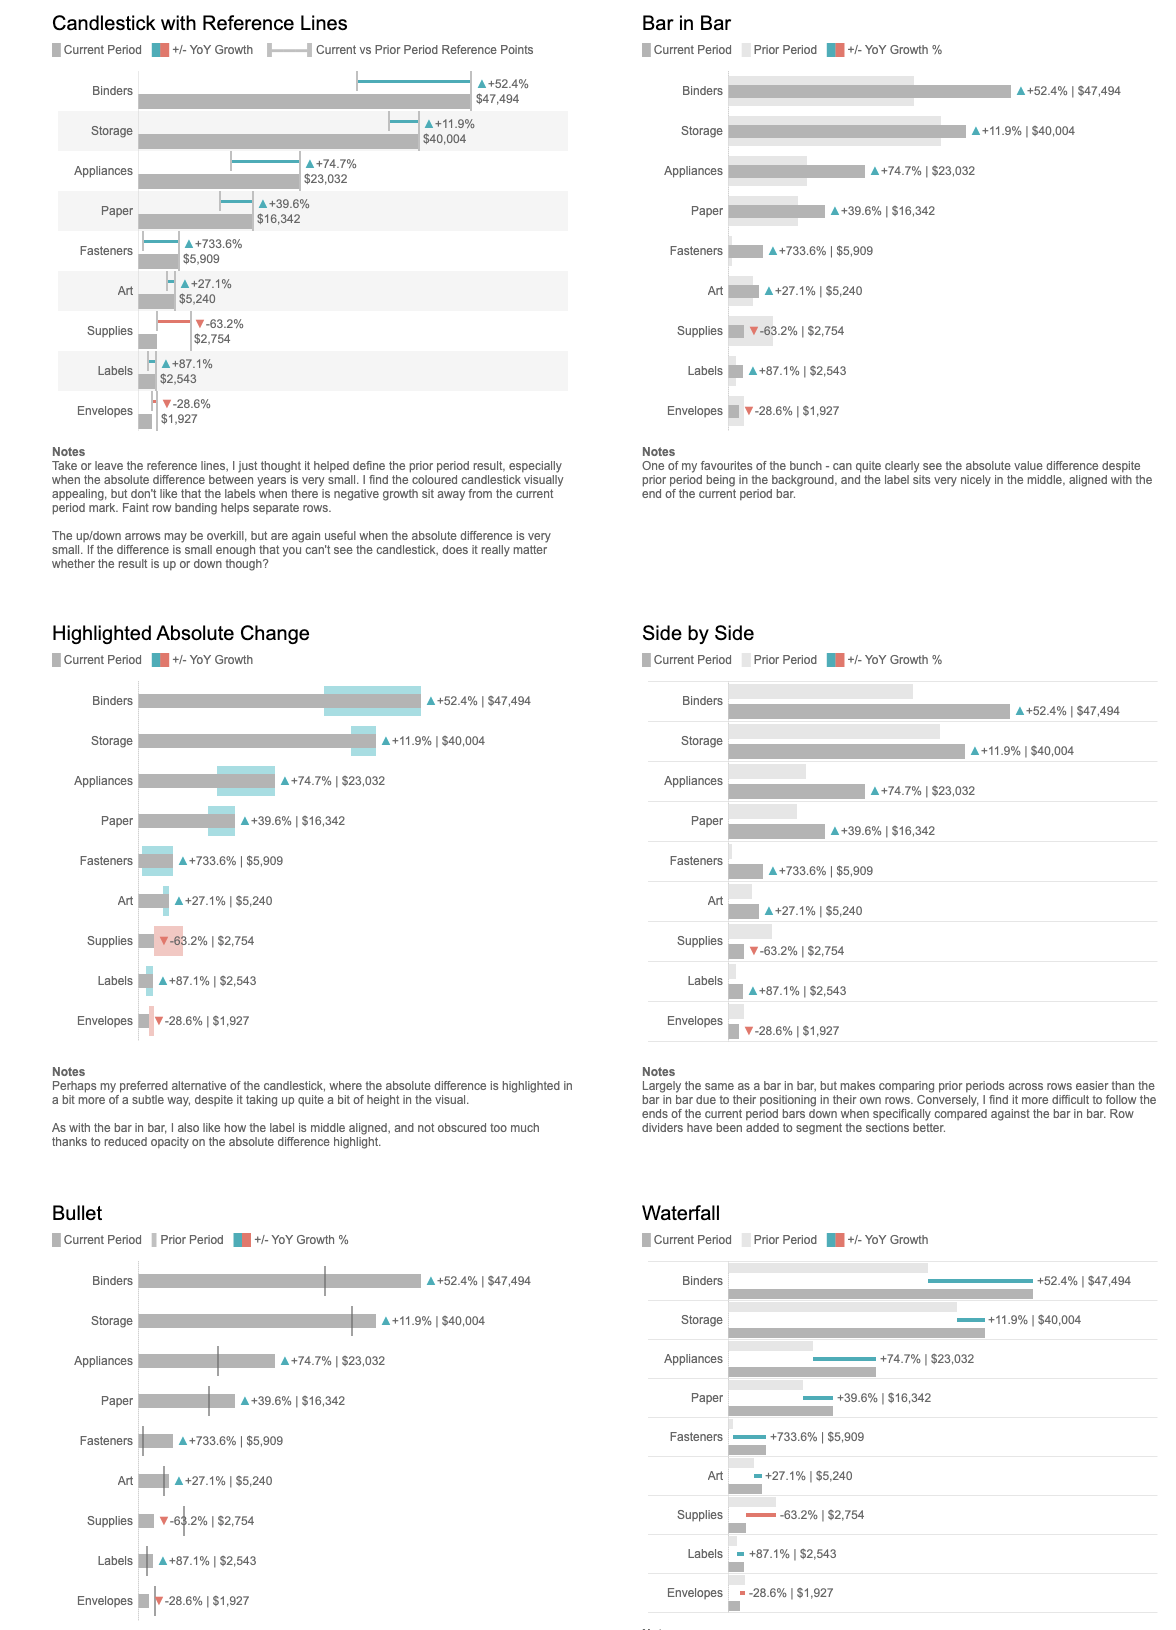
One that caught me attention is Tableau's Viz of the Day: [Seven Bar Charts to Visualise Year-Over-Year Growth](https://public.tableau.com/app/profile/jacob.rothemund/viz/SevenBarChartstoVisualiseYear-Over-YearGrowth/Dashboard)
|
|
|
|
|
|
|
|
Here is what my attempt to replicate the charts in vega-lite looks like (each chart can be viewed in vega-editor via burger menu on the right top):
|
|
|
|
## Initial Dataset
|
|
|
|
| Category | Current | Previous |
|
|
|-------------|------------|------------|
|
|
| Appliances | 22962.174 | 13183.887 |
|
|
| Art | 5122.616 | 4004.32 |
|
|
| Binders | 47133.138 | 29871.657 |
|
|
| Envelopes | 1926.632 | 2698.966 |
|
|
| Fasteners | 604.648 | 667.028 |
|
|
| Labels | 2416.994 | 1276.072 |
|
|
| Paper | 15947.488 | 11683.83 |
|
|
| Storage | 39407.746 | 35680.368 |
|
|
| Supplies | 2727.558 | 7482.186 |
|
|
|
|
---
|
|
|
|
## Bar-in-bar
|
|
|
|
This one looks like it's the most straightofrward one.
|
|
Still, before moving forward, we need to perform several transformations that would allow us to calculate percentages and neatly show them as text:
|
|
|
|
```json
|
|
{"transform": [
|
|
{
|
|
"calculate": "toNumber(datum.Current)",
|
|
"as": "cur_value"
|
|
},
|
|
{
|
|
"calculate": "toNumber(datum.Previous)",
|
|
"as": "prev_value"
|
|
},
|
|
{
|
|
"calculate": "(datum.cur_value - datum.prev_value) / datum.prev_value",
|
|
"as": "difference"
|
|
},
|
|
{
|
|
"calculate": "datum.difference > 0",
|
|
"as": "is_positive"
|
|
},
|
|
{
|
|
"calculate": "max(datum.cur_value, datum.prev_value)",
|
|
"as": "max_value"
|
|
},
|
|
{
|
|
"calculate": "format(datum.difference, '+.0%') + ' | ' + format(datum.cur_value, '$,.0f')",
|
|
"as": "text_label"
|
|
}
|
|
]}
|
|
```
|
|
After this, we can make the following layers:
|
|
- Wider `bar` mark with previous value "background"
|
|
- Thinner `bar` mark with actual numbers
|
|
- `text` mark with calculated `text_label`
|
|
- two separate `point` mark layers, each with a different color but more importantly - `triangle-up` and `triangle-down`. We cannot encode the two marks dynamically (or, rather, we cannot make dynamic fill color which is my goal here) so we'll need to do it separately for positive and negative changes.
|
|
|
|
{{< vega-lite id="chart-bar-in-bar" actions="true">}}
|
|
{
|
|
"$schema": "https://vega.github.io/schema/vega-lite/v5.json",
|
|
"width": 400,
|
|
"height": 400,
|
|
"config": {
|
|
"font": "monospace",
|
|
"axis": {
|
|
"domainOpacity": 0,
|
|
"gridOpacity": 0,
|
|
"tickOpacity": 0,
|
|
"domain": false
|
|
},
|
|
"view": {
|
|
"stroke": null
|
|
},
|
|
"background": "#eee",
|
|
"padding": 20,
|
|
"text": {
|
|
"color": "#444"
|
|
},
|
|
"axisX": {
|
|
"titleColor": "#444"
|
|
},
|
|
"axisY": {
|
|
"labelFontSize": 14,
|
|
"labelColor": "#444"
|
|
}
|
|
},
|
|
"encoding": {
|
|
"y": {
|
|
"field": "Category",
|
|
"sort": {
|
|
"field": "cur_value",
|
|
"order": "descending"
|
|
},
|
|
"title": null
|
|
},
|
|
"x": {
|
|
"field": "cur_value",
|
|
"aggregate": "sum",
|
|
"axis": {
|
|
"grid": false,
|
|
"labels": false,
|
|
"ticks": false
|
|
},
|
|
"title": null
|
|
},
|
|
"tooltip": [
|
|
{
|
|
"field": "Category"
|
|
},
|
|
{
|
|
"field": "cur_value",
|
|
"format": "$,.0f",
|
|
"title": "Current Period"
|
|
},
|
|
{
|
|
"field": "prev_value",
|
|
"format": "$,.0f",
|
|
"title": "Previous Period"
|
|
},
|
|
{
|
|
"field": "difference",
|
|
"format": ",.1%",
|
|
"title": "Difference"
|
|
}
|
|
]
|
|
},
|
|
"layer": [
|
|
{
|
|
"mark": {
|
|
"type": "bar",
|
|
"opacity": 0.7,
|
|
"color": "lightgrey",
|
|
"size": 34
|
|
},
|
|
"encoding": {
|
|
"x": {
|
|
"field": "Previous",
|
|
"aggregate": "sum"
|
|
}
|
|
}
|
|
},
|
|
{
|
|
"mark": {
|
|
"type": "bar",
|
|
"tooltip": true,
|
|
"opacity": 1,
|
|
"size": 20,
|
|
"color": "slategrey"
|
|
}
|
|
},
|
|
{
|
|
"mark": {
|
|
"type": "text",
|
|
"xOffset": 15,
|
|
"align": "left"
|
|
},
|
|
"encoding": {
|
|
"text": {
|
|
"field": "text_label"
|
|
},
|
|
"x": {
|
|
"field": "max_value"
|
|
}
|
|
}
|
|
},
|
|
{
|
|
"mark": {
|
|
"type": "point",
|
|
"shape": "triangle-up",
|
|
"color": "teal",
|
|
"fill": "teal",
|
|
"size": 80,
|
|
"xOffset": 8
|
|
},
|
|
"encoding": {
|
|
"x": {
|
|
"field": "max_value"
|
|
}
|
|
},
|
|
"transform": [
|
|
{
|
|
"filter": "datum.is_positive"
|
|
}
|
|
]
|
|
},
|
|
{
|
|
"mark": {
|
|
"type": "point",
|
|
"shape": "triangle-down",
|
|
"color": "red",
|
|
"fill": "red",
|
|
"size": 80,
|
|
"xOffset": 8
|
|
},
|
|
"encoding": {
|
|
"x": {
|
|
"field": "max_value"
|
|
}
|
|
},
|
|
"transform": [
|
|
{
|
|
"filter": "!(datum.is_positive)"
|
|
}
|
|
]
|
|
}
|
|
],
|
|
"data": {
|
|
"values": [
|
|
{
|
|
"Category": "Appliances",
|
|
"Current": "22962.174",
|
|
"Previous": "13183.887"
|
|
},
|
|
{
|
|
"Category": "Art",
|
|
"Current": "5122.616",
|
|
"Previous": "4004.32"
|
|
},
|
|
{
|
|
"Category": "Binders",
|
|
"Current": "47133.138",
|
|
"Previous": "29871.657"
|
|
},
|
|
{
|
|
"Category": "Envelopes",
|
|
"Current": "1926.632",
|
|
"Previous": "2698.966"
|
|
},
|
|
{
|
|
"Category": "Fasteners",
|
|
"Current": "604.648",
|
|
"Previous": "667.028"
|
|
},
|
|
{
|
|
"Category": "Labels",
|
|
"Current": "2416.994",
|
|
"Previous": "1276.072"
|
|
},
|
|
{
|
|
"Category": "Paper",
|
|
"Current": "15947.488",
|
|
"Previous": "11683.83"
|
|
},
|
|
{
|
|
"Category": "Storage",
|
|
"Current": "39407.746",
|
|
"Previous": "35680.368"
|
|
},
|
|
{
|
|
"Category": "Supplies",
|
|
"Current": "2727.558",
|
|
"Previous": "7482.186"
|
|
}
|
|
]
|
|
},
|
|
"transform": [
|
|
{
|
|
"calculate": "toNumber(datum.Current)",
|
|
"as": "cur_value"
|
|
},
|
|
{
|
|
"calculate": "toNumber(datum.Previous)",
|
|
"as": "prev_value"
|
|
},
|
|
{
|
|
"calculate": "(datum.cur_value - datum.prev_value) / datum.prev_value",
|
|
"as": "difference"
|
|
},
|
|
{
|
|
"calculate": "datum.difference > 0",
|
|
"as": "is_positive"
|
|
},
|
|
{
|
|
"calculate": "max(datum.cur_value, datum.prev_value)",
|
|
"as": "max_value"
|
|
},
|
|
{
|
|
"calculate": "format(datum.difference, '+.0%') + ' | ' + format(datum.cur_value, '$,.0f')",
|
|
"as": "text_label"
|
|
}
|
|
]
|
|
}
|
|
{{< /vega-lite >}}
|
|
|
|
|
|
## Highlighted Absolute Change
|
|
|
|
This one largely repeats the bar-in-bar, with the exception that the highlighted changes are achieved by combining `x` and `x2` channels combined with `color`
|
|
{{< vega-lite id="chart-highlighted-absolute-change" actions="true">}}
|
|
{
|
|
"$schema": "https://vega.github.io/schema/vega-lite/v5.json",
|
|
"width": 400,
|
|
"height": 400,
|
|
"config": {
|
|
"font": "monospace",
|
|
"axis": {
|
|
"domainOpacity": 0,
|
|
"gridOpacity": 0,
|
|
"tickOpacity": 0,
|
|
"domain": false
|
|
},
|
|
"view": {
|
|
"stroke": null
|
|
},
|
|
"background": "#eee",
|
|
"padding": 20,
|
|
"text": {
|
|
"color": "#444"
|
|
},
|
|
"axisX": {
|
|
"titleColor": "#444"
|
|
},
|
|
"axisY": {
|
|
"labelFontSize": 14,
|
|
"labelColor": "#444"
|
|
}
|
|
},
|
|
"encoding": {
|
|
"y": {
|
|
"field": "Category",
|
|
"sort": {
|
|
"field": "cur_value",
|
|
"order": "descending"
|
|
},
|
|
"title": null
|
|
},
|
|
"x": {
|
|
"field": "cur_value",
|
|
"aggregate": "sum",
|
|
"axis": {
|
|
"grid": false,
|
|
"labels": false,
|
|
"ticks": false
|
|
},
|
|
"title": null
|
|
},
|
|
"tooltip": [
|
|
{
|
|
"field": "Category"
|
|
},
|
|
{
|
|
"field": "cur_value",
|
|
"format": "$,.0f",
|
|
"title": "Current Period"
|
|
},
|
|
{
|
|
"field": "prev_value",
|
|
"format": "$,.0f",
|
|
"title": "Previous Period"
|
|
},
|
|
{
|
|
"field": "difference",
|
|
"format": ",.1%",
|
|
"title": "Difference"
|
|
}
|
|
]
|
|
},
|
|
"layer": [
|
|
{
|
|
"mark": {
|
|
"type": "bar",
|
|
"opacity": 0.4,
|
|
"color": "lightgrey",
|
|
"size": 34
|
|
},
|
|
"encoding": {
|
|
"x": {
|
|
"field": "prev_value",
|
|
"aggregate": "sum"
|
|
},
|
|
"x2": {
|
|
"field": "cur_value",
|
|
"aggregate": "sum"
|
|
},
|
|
"color": {
|
|
"field": "is_positive_text",
|
|
"legend": {
|
|
"orient": "bottom-right",
|
|
"title": "YoY Growth"
|
|
},
|
|
"scale": {
|
|
"domain": [
|
|
"Positive",
|
|
"Negative"
|
|
],
|
|
"range": [
|
|
"teal",
|
|
"red"
|
|
]
|
|
}
|
|
}
|
|
}
|
|
},
|
|
{
|
|
"mark": {
|
|
"type": "bar",
|
|
"tooltip": true,
|
|
"opacity": 1,
|
|
"size": 20,
|
|
"color": "slategrey"
|
|
}
|
|
},
|
|
{
|
|
"mark": {
|
|
"type": "text",
|
|
"xOffset": 15,
|
|
"align": "left"
|
|
},
|
|
"encoding": {
|
|
"text": {
|
|
"field": "text_label"
|
|
},
|
|
"x": {
|
|
"field": "max_value"
|
|
}
|
|
}
|
|
},
|
|
{
|
|
"mark": {
|
|
"type": "point",
|
|
"shape": "triangle-up",
|
|
"color": "teal",
|
|
"fill": "teal",
|
|
"size": 80,
|
|
"xOffset": 8
|
|
},
|
|
"encoding": {
|
|
"x": {
|
|
"field": "max_value"
|
|
}
|
|
},
|
|
"transform": [
|
|
{
|
|
"filter": "datum.is_positive"
|
|
}
|
|
]
|
|
},
|
|
{
|
|
"mark": {
|
|
"type": "point",
|
|
"shape": "triangle-down",
|
|
"color": "red",
|
|
"fill": "red",
|
|
"size": 80,
|
|
"xOffset": 8
|
|
},
|
|
"encoding": {
|
|
"x": {
|
|
"field": "max_value"
|
|
}
|
|
},
|
|
"transform": [
|
|
{
|
|
"filter": "!(datum.is_positive)"
|
|
}
|
|
]
|
|
}
|
|
],
|
|
"data": {
|
|
"values": [
|
|
{
|
|
"Category": "Appliances",
|
|
"Current": "22962.174",
|
|
"Previous": "13183.887"
|
|
},
|
|
{
|
|
"Category": "Art",
|
|
"Current": "5122.616",
|
|
"Previous": "4004.32"
|
|
},
|
|
{
|
|
"Category": "Binders",
|
|
"Current": "47133.138",
|
|
"Previous": "29871.657"
|
|
},
|
|
{
|
|
"Category": "Envelopes",
|
|
"Current": "1926.632",
|
|
"Previous": "2698.966"
|
|
},
|
|
{
|
|
"Category": "Fasteners",
|
|
"Current": "604.648",
|
|
"Previous": "667.028"
|
|
},
|
|
{
|
|
"Category": "Labels",
|
|
"Current": "2416.994",
|
|
"Previous": "1276.072"
|
|
},
|
|
{
|
|
"Category": "Paper",
|
|
"Current": "15947.488",
|
|
"Previous": "11683.83"
|
|
},
|
|
{
|
|
"Category": "Storage",
|
|
"Current": "39407.746",
|
|
"Previous": "35680.368"
|
|
},
|
|
{
|
|
"Category": "Supplies",
|
|
"Current": "2727.558",
|
|
"Previous": "7482.186"
|
|
}
|
|
]
|
|
},
|
|
"transform": [
|
|
{
|
|
"calculate": "toNumber(datum.Current)",
|
|
"as": "cur_value"
|
|
},
|
|
{
|
|
"calculate": "toNumber(datum.Previous)",
|
|
"as": "prev_value"
|
|
},
|
|
{
|
|
"calculate": "(datum.cur_value - datum.prev_value) / datum.prev_value",
|
|
"as": "difference"
|
|
},
|
|
{
|
|
"calculate": "datum.difference > 0",
|
|
"as": "is_positive"
|
|
},
|
|
{
|
|
"calculate": "datum.difference > 0? 'Positive' : 'Negative'",
|
|
"as": "is_positive_text"
|
|
},
|
|
{
|
|
"calculate": "max(datum.cur_value, datum.prev_value)",
|
|
"as": "max_value"
|
|
},
|
|
{
|
|
"calculate": "format(datum.difference, '+.0%') + ' | ' + format(datum.cur_value, '$,.0f')",
|
|
"as": "text_label"
|
|
}
|
|
]
|
|
}
|
|
{{< /vega-lite >}}
|
|
|
|
## Bullet
|
|
|
|
Key difference in schema here - instead of highlighted bar mark, we use `tick` with exact value for the previous period.
|
|
|
|
{{< vega-lite id="chart-bullet" actions="true">}}
|
|
{
|
|
"$schema": "https://vega.github.io/schema/vega-lite/v5.json",
|
|
"width": 400,
|
|
"height": 400,
|
|
"config": {
|
|
"font": "monospace",
|
|
"axis": {
|
|
"domainOpacity": 0,
|
|
"gridOpacity": 0,
|
|
"tickOpacity": 0,
|
|
"domain": false
|
|
},
|
|
"view": {
|
|
"stroke": null
|
|
},
|
|
"background": "#eee",
|
|
"padding": 20,
|
|
"text": {
|
|
"color": "#444"
|
|
},
|
|
"axisX": {
|
|
"titleColor": "#444"
|
|
},
|
|
"axisY": {
|
|
"labelFontSize": 14,
|
|
"labelColor": "#444"
|
|
}
|
|
},
|
|
"encoding": {
|
|
"y": {
|
|
"field": "Category",
|
|
"sort": {
|
|
"field": "cur_value",
|
|
"order": "descending"
|
|
},
|
|
"title": null
|
|
},
|
|
"x": {
|
|
"field": "cur_value",
|
|
"aggregate": "sum",
|
|
"axis": {
|
|
"grid": false,
|
|
"labels": false,
|
|
"ticks": false
|
|
},
|
|
"title": null
|
|
},
|
|
"tooltip": [
|
|
{
|
|
"field": "Category"
|
|
},
|
|
{
|
|
"field": "cur_value",
|
|
"format": "$,.0f",
|
|
"title": "Current Period"
|
|
},
|
|
{
|
|
"field": "prev_value",
|
|
"format": "$,.0f",
|
|
"title": "Previous Period"
|
|
},
|
|
{
|
|
"field": "difference",
|
|
"format": ",.1%",
|
|
"title": "Difference"
|
|
}
|
|
]
|
|
},
|
|
"layer": [
|
|
{
|
|
"mark": {
|
|
"type": "bar",
|
|
"tooltip": true,
|
|
"opacity": 1,
|
|
"size": 20,
|
|
"color": "slategrey"
|
|
}
|
|
},
|
|
{
|
|
"mark": {
|
|
"type": "tick",
|
|
"opacity": 1,
|
|
"color": "#555",
|
|
"thickness": 4,
|
|
"height": 30,
|
|
"fillOpacity": 0.8
|
|
},
|
|
"encoding": {
|
|
"x": {
|
|
"field": "prev_value",
|
|
"aggregate": "sum"
|
|
}
|
|
}
|
|
},
|
|
{
|
|
"mark": {
|
|
"type": "text",
|
|
"xOffset": 15,
|
|
"align": "left"
|
|
},
|
|
"encoding": {
|
|
"text": {
|
|
"field": "text_label"
|
|
},
|
|
"x": {
|
|
"field": "max_value"
|
|
}
|
|
}
|
|
},
|
|
{
|
|
"mark": {
|
|
"type": "point",
|
|
"shape": "triangle-up",
|
|
"color": "teal",
|
|
"fill": "teal",
|
|
"size": 80,
|
|
"xOffset": 8
|
|
},
|
|
"encoding": {
|
|
"x": {
|
|
"field": "max_value"
|
|
}
|
|
},
|
|
"transform": [
|
|
{
|
|
"filter": "datum.is_positive"
|
|
}
|
|
]
|
|
},
|
|
{
|
|
"mark": {
|
|
"type": "point",
|
|
"shape": "triangle-down",
|
|
"color": "red",
|
|
"fill": "red",
|
|
"size": 80,
|
|
"xOffset": 8
|
|
},
|
|
"encoding": {
|
|
"x": {
|
|
"field": "max_value"
|
|
}
|
|
},
|
|
"transform": [
|
|
{
|
|
"filter": "!(datum.is_positive)"
|
|
}
|
|
]
|
|
}
|
|
],
|
|
"data": {
|
|
"values": [
|
|
{
|
|
"Category": "Appliances",
|
|
"Current": "22962.174",
|
|
"Previous": "13183.887"
|
|
},
|
|
{
|
|
"Category": "Art",
|
|
"Current": "5122.616",
|
|
"Previous": "4004.32"
|
|
},
|
|
{
|
|
"Category": "Binders",
|
|
"Current": "47133.138",
|
|
"Previous": "29871.657"
|
|
},
|
|
{
|
|
"Category": "Envelopes",
|
|
"Current": "1926.632",
|
|
"Previous": "2698.966"
|
|
},
|
|
{
|
|
"Category": "Fasteners",
|
|
"Current": "604.648",
|
|
"Previous": "667.028"
|
|
},
|
|
{
|
|
"Category": "Labels",
|
|
"Current": "2416.994",
|
|
"Previous": "1276.072"
|
|
},
|
|
{
|
|
"Category": "Paper",
|
|
"Current": "15947.488",
|
|
"Previous": "11683.83"
|
|
},
|
|
{
|
|
"Category": "Storage",
|
|
"Current": "39407.746",
|
|
"Previous": "35680.368"
|
|
},
|
|
{
|
|
"Category": "Supplies",
|
|
"Current": "2727.558",
|
|
"Previous": "7482.186"
|
|
}
|
|
]
|
|
},
|
|
"transform": [
|
|
{
|
|
"calculate": "toNumber(datum.Current)",
|
|
"as": "cur_value"
|
|
},
|
|
{
|
|
"calculate": "toNumber(datum.Previous)",
|
|
"as": "prev_value"
|
|
},
|
|
{
|
|
"calculate": "(datum.cur_value - datum.prev_value) / datum.prev_value",
|
|
"as": "difference"
|
|
},
|
|
{
|
|
"calculate": "datum.difference > 0",
|
|
"as": "is_positive"
|
|
},
|
|
{
|
|
"calculate": "datum.difference > 0? 'Positive' : 'Negative'",
|
|
"as": "is_positive_text"
|
|
},
|
|
{
|
|
"calculate": "max(datum.cur_value, datum.prev_value)",
|
|
"as": "max_value"
|
|
},
|
|
{
|
|
"calculate": "format(datum.difference, '+.0%') + ' | ' + format(datum.cur_value, '$,.0f')",
|
|
"as": "text_label"
|
|
}
|
|
]
|
|
}
|
|
{{< /vega-lite >}}
|
|
|
|
|
|
## Direction Arrows
|
|
|
|
|
|
{{< vega-lite id="chart-direction-arrows" actions="true">}}
|
|
{
|
|
"$schema": "https://vega.github.io/schema/vega-lite/v5.json",
|
|
"width": 400,
|
|
"height": 400,
|
|
"config": {
|
|
"font": "monospace",
|
|
"axis": {
|
|
"domainOpacity": 0,
|
|
"gridOpacity": 0,
|
|
"tickOpacity": 0,
|
|
"domain": false
|
|
},
|
|
"view": {
|
|
"stroke": null
|
|
},
|
|
"background": "#eee",
|
|
"padding": 20,
|
|
"text": {
|
|
"color": "#444",
|
|
"opacity": 0.5
|
|
},
|
|
"axisX": {
|
|
"titleColor": "#444"
|
|
},
|
|
"axisY": {
|
|
"labelFontSize": 14,
|
|
"labelColor": "#444"
|
|
}
|
|
},
|
|
"encoding": {
|
|
"y": {
|
|
"field": "Category",
|
|
"sort": {
|
|
"field": "cur_value",
|
|
"order": "descending"
|
|
},
|
|
"title": null
|
|
},
|
|
"x": {
|
|
"field": "cur_value",
|
|
"aggregate": "sum",
|
|
"axis": {
|
|
"grid": false,
|
|
"labels": false,
|
|
"ticks": false
|
|
},
|
|
"title": null
|
|
},
|
|
"tooltip": [
|
|
{
|
|
"field": "Category"
|
|
},
|
|
{
|
|
"field": "cur_value",
|
|
"format": "$,.0f",
|
|
"title": "Current Period"
|
|
},
|
|
{
|
|
"field": "prev_value",
|
|
"format": "$,.0f",
|
|
"title": "Previous Period"
|
|
},
|
|
{
|
|
"field": "difference",
|
|
"format": ",.1%",
|
|
"title": "Difference"
|
|
}
|
|
]
|
|
},
|
|
"layer": [
|
|
{
|
|
"mark": {
|
|
"type": "bar",
|
|
"opacity": 1,
|
|
"color": "lightgrey",
|
|
"size": 4
|
|
},
|
|
"encoding": {
|
|
"x": {
|
|
"field": "prev_value",
|
|
"aggregate": "sum"
|
|
},
|
|
"x2": {
|
|
"field": "cur_value",
|
|
"aggregate": "sum"
|
|
},
|
|
"color": {
|
|
"field": "is_positive_text",
|
|
"legend": {
|
|
"orient": "bottom-right",
|
|
"title": "YoY Growth",
|
|
"symbolOpacity": 0.3
|
|
},
|
|
"scale": {
|
|
"domain": [
|
|
"Positive",
|
|
"Negative"
|
|
],
|
|
"range": [
|
|
"teal",
|
|
"red"
|
|
]
|
|
}
|
|
}
|
|
}
|
|
},
|
|
{
|
|
"mark": {
|
|
"type": "text",
|
|
"xOffset": 15,
|
|
"align": "left"
|
|
},
|
|
"encoding": {
|
|
"text": {
|
|
"field": "text_label"
|
|
},
|
|
"x": {
|
|
"field": "max_value"
|
|
}
|
|
}
|
|
},
|
|
{
|
|
"mark": {
|
|
"type": "point",
|
|
"shape": "triangle-right",
|
|
"color": "teal",
|
|
"fill": "teal",
|
|
"size": 80,
|
|
"xOffset": 0,
|
|
"opacity": 1
|
|
},
|
|
"encoding": {
|
|
"x": {
|
|
"field": "max_value"
|
|
}
|
|
},
|
|
"transform": [
|
|
{
|
|
"filter": "datum.is_positive"
|
|
}
|
|
]
|
|
},
|
|
{
|
|
"mark": {
|
|
"type": "point",
|
|
"shape": "triangle-left",
|
|
"color": "red",
|
|
"fill": "red",
|
|
"size": 80,
|
|
"xOffset": 0,
|
|
"opacity": 1
|
|
},
|
|
"encoding": {
|
|
"x": {
|
|
"field": "cur_value"
|
|
}
|
|
},
|
|
"transform": [
|
|
{
|
|
"filter": "!(datum.is_positive)"
|
|
}
|
|
]
|
|
}
|
|
],
|
|
"data": {
|
|
"values": [
|
|
{
|
|
"Category": "Appliances",
|
|
"Current": "22962.174",
|
|
"Previous": "13183.887"
|
|
},
|
|
{
|
|
"Category": "Art",
|
|
"Current": "5122.616",
|
|
"Previous": "4004.32"
|
|
},
|
|
{
|
|
"Category": "Binders",
|
|
"Current": "47133.138",
|
|
"Previous": "29871.657"
|
|
},
|
|
{
|
|
"Category": "Envelopes",
|
|
"Current": "1926.632",
|
|
"Previous": "2698.966"
|
|
},
|
|
{
|
|
"Category": "Fasteners",
|
|
"Current": "604.648",
|
|
"Previous": "667.028"
|
|
},
|
|
{
|
|
"Category": "Labels",
|
|
"Current": "2416.994",
|
|
"Previous": "1276.072"
|
|
},
|
|
{
|
|
"Category": "Paper",
|
|
"Current": "15947.488",
|
|
"Previous": "11683.83"
|
|
},
|
|
{
|
|
"Category": "Storage",
|
|
"Current": "39407.746",
|
|
"Previous": "35680.368"
|
|
},
|
|
{
|
|
"Category": "Supplies",
|
|
"Current": "2727.558",
|
|
"Previous": "7482.186"
|
|
}
|
|
]
|
|
},
|
|
"transform": [
|
|
{
|
|
"calculate": "toNumber(datum.Current)",
|
|
"as": "cur_value"
|
|
},
|
|
{
|
|
"calculate": "toNumber(datum.Previous)",
|
|
"as": "prev_value"
|
|
},
|
|
{
|
|
"calculate": "(datum.cur_value - datum.prev_value) / datum.prev_value",
|
|
"as": "difference"
|
|
},
|
|
{
|
|
"calculate": "datum.difference > 0",
|
|
"as": "is_positive"
|
|
},
|
|
{
|
|
"calculate": "datum.difference > 0? 'Positive' : 'Negative'",
|
|
"as": "is_positive_text"
|
|
},
|
|
{
|
|
"calculate": "max(datum.cur_value, datum.prev_value)",
|
|
"as": "max_value"
|
|
},
|
|
{
|
|
"calculate": "format(datum.difference, '+.0%') + ' | ' + format(datum.cur_value, '$,.0f')",
|
|
"as": "text_label"
|
|
}
|
|
]
|
|
}
|
|
{{< /vega-lite >}}
|
|
|
|
|
|
## Error Bars |